Tập tin:Bitcoin electricity consumption.svg

Kích thước bản xem trước PNG này của tập tin SVG: 771×600 điểm ảnh. Độ phân giải khác: 309×240 điểm ảnh | 617×480 điểm ảnh | 988×768 điểm ảnh | 1.280×996 điểm ảnh | 2.560×1.991 điểm ảnh | 810×630 điểm ảnh.
Tập tin gốc (tập tin SVG, 810×630 điểm ảnh trên danh nghĩa, kích thước: 412 kB)
Tập tin này từ Wikimedia Commons. Trang miêu tả nó ở đấy được sao chép dưới đây. Commons là kho lưu trữ tập tin phương tiện có giấy phép tự do. Bạn có thể tham gia. |
Miêu tả
| Miêu tả |
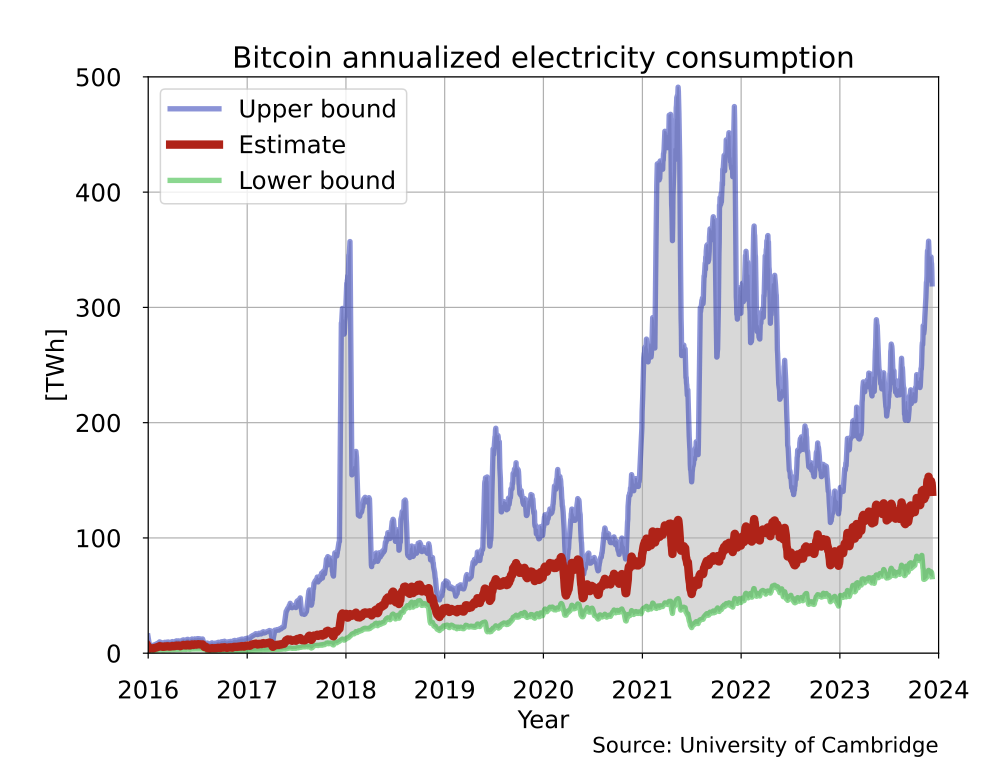
English: Bitcoin electricity consumption based on data from the University of Cambridge (Source: Cambridge Bitcoin Electricity Consumption Index. https://cbeci.org/). This plot is an updated SVG replacement for File:Bitcoin electricity consumption.png. (The country equivalents in the old plot have been left out as requested at Commons:Graphic_Lab/Illustration_workshop#Bitcoin_annualized_electricity_consumption.) |
||
| Ngày | |||
| Nguồn gốc |
Tác phẩm được tạo bởi người tải lên Data sources: |
||
| Tác giả | Morn | ||
| SVG genesis | This plot was created with Matplotlib. | ||
| Mã nguồn | Python code
|

|
This file may be updated to reflect new information. If you wish to use a specific version of the file without new updates being mirrored, please upload the required version as a separate file. |
Giấy phép
Tôi, người giữ bản quyền tác phẩm này, từ đây phát hành nó theo giấy phép sau:
| Tập tin này được phân phối theo Creative Commons Hiến tặng vào Phạm vi Công cộng Toàn thế giới CC0. | |
| Người nào gán tài liệu này với tác phẩm nghĩa là đã hiến tác phẩm cho phạm vi công cộng bằng cách từ bỏ mọi quyền lợi của người đó đối với tác phẩm theo quy định của luật bản quyền, có hiệu lực trên toàn thế giới và các quyền lợi pháp lý phụ mà người đó có được trong tác phẩm, đến mức độ mà luật pháp cho phép. Bạn được tự do sao chép, phân phối, và biểu diễn tác phẩm này, tất cả đều không bắt buộc ghi công.
|
Lịch sử tập tin
Nhấn vào ngày/giờ để xem nội dung tập tin tại thời điểm đó.
| Ngày/giờ | Hình xem trước | Kích cỡ | Thành viên | Miêu tả | |
|---|---|---|---|---|---|
| hiện tại | 10:42, ngày 10 tháng 12 năm 2023 | | 810×630 (412 kB) | Morn | change labels in legend |
| 17:11, ngày 9 tháng 12 năm 2023 |  | 810×630 (412 kB) | Morn | Uploaded own work with UploadWizard |
Trang sử dụng tập tin
Có 1 trang tại Wikipedia tiếng Việt có liên kết đến tập tin (không hiển thị trang ở các dự án khác):
Sử dụng tập tin toàn cục
Những wiki sau đang sử dụng tập tin này:
- Trang sử dụng tại de.wikipedia.org
- Trang sử dụng tại en.wikipedia.org
- Trang sử dụng tại fa.wikipedia.org
- Trang sử dụng tại fi.wikipedia.org
- Trang sử dụng tại fr.wikipedia.org
- Trang sử dụng tại lv.wikipedia.org