Tập tin:RiemannCriticalLine.svg

Kích thước bản xem trước PNG này của tập tin SVG: 800×372 điểm ảnh. Độ phân giải khác: 320×149 điểm ảnh | 640×298 điểm ảnh | 1.024×476 điểm ảnh | 1.280×595 điểm ảnh | 2.560×1.191 điểm ảnh | 933×434 điểm ảnh.
Tập tin gốc (tập tin SVG, 933×434 điểm ảnh trên danh nghĩa, kích thước: 50 kB)
Tập tin này từ Wikimedia Commons. Trang miêu tả nó ở đấy được sao chép dưới đây. Commons là kho lưu trữ tập tin phương tiện có giấy phép tự do. Bạn có thể tham gia. |
W3C-validity not checked.
Miêu tả
| Miêu tả |
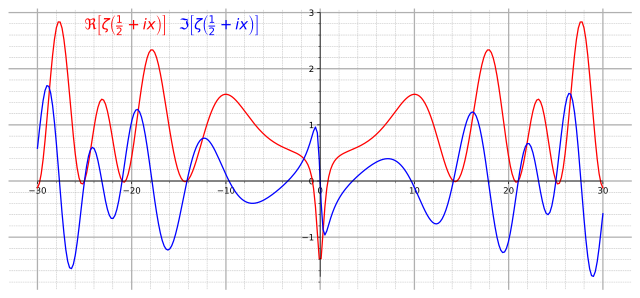
English: Graph of real (red) and imaginary (blue) parts of the critical line Re(z)=1/2 of the Riemann zeta function. |
||
| Ngày | |||
| Nguồn gốc |
Own work. Made with Mathematica using the following code: Show[Plot[{Re[Zeta[1/2+I x]], Im[Zeta[1/2+I x]]}, {x,-30, 30},AxesLabel->{"x"} , PlotStyle->{Red, Blue}, Ticks->{Table[4x-28,{x,0,14}]}, ImageSize->{800,600}],
Graphics[Text[Style[\[DoubleStruckCapitalR][\[Zeta][ I x + "1/2"]],14,Red ,Background ->White],{-22,2.6} ]],
Graphics[Text[Style[\[GothicCapitalI][\[Zeta][ I x + "1/2"]],14,Blue ,Background ->White],{-14,2.6} ]]] |
||
| Tác giả | Slonzor | ||
| Giấy phép (Dùng lại tập tin) |
Public Domain | ||
| SVG genesis | This plot was created with Matplotlib by Krishnavedala. | ||
| Mã nguồn | Python code
|
Giấy phép
| Tôi, người giữ bản quyền của tác phẩm này, chuyển tác phẩm này vào phạm vi công cộng. Điều này có giá trị trên toàn thế giới. Tại một quốc gia mà luật pháp không cho phép điều này, thì: Tôi cho phép tất cả mọi người được quyền sử dụng tác phẩm này với bất cứ mục đích nào, không kèm theo bất kỳ điều kiện nào, trừ phi luật pháp yêu cầu những điều kiện đó. |
Lịch sử tập tin
Nhấn vào ngày/giờ để xem nội dung tập tin tại thời điểm đó.
| Ngày/giờ | Hình xem trước | Kích cỡ | Thành viên | Miêu tả | |
|---|---|---|---|---|---|
| hiện tại | 20:01, ngày 23 tháng 8 năm 2017 | | 933×434 (50 kB) | Krishnavedala | much reduced vector version |
| 22:28, ngày 24 tháng 9 năm 2009 |  | 800×600 (122 kB) | Geek3 | linewidth=1px | |
| 19:33, ngày 20 tháng 11 năm 2008 |  | 800×600 (122 kB) | Slonzor | Man i've messed this up a lot of times. | |
| 19:27, ngày 20 tháng 11 năm 2008 |  | 800×600 (3,36 MB) | Slonzor | ||
| 19:23, ngày 20 tháng 11 năm 2008 |  | 800×600 (3,36 MB) | Slonzor | ||
| 19:18, ngày 20 tháng 11 năm 2008 |  | 800×600 (3,36 MB) | Slonzor | ||
| 19:13, ngày 20 tháng 11 năm 2008 |  | 800×600 (79 kB) | Slonzor | {{Information |Description={{en|1=Graph of real (red) and imaginary (blue) parts of the critical line Re(z)=1/2 of the Riemann zeta function.}} |Source=Own work. Made with Mathematica using the following code: <code><nowiki>Show[Plot[{Re[Zeta[1/2+I x]], |
Trang sử dụng tập tin
Có 3 trang tại Wikipedia tiếng Việt có liên kết đến tập tin (không hiển thị trang ở các dự án khác):
Sử dụng tập tin toàn cục
Những wiki sau đang sử dụng tập tin này:
- Trang sử dụng tại ar.wikipedia.org
- Trang sử dụng tại ba.wikipedia.org
- Trang sử dụng tại be.wikipedia.org
- Trang sử dụng tại ca.wikipedia.org
- Trang sử dụng tại ckb.wikipedia.org
- Trang sử dụng tại da.wikipedia.org
- Trang sử dụng tại el.wikipedia.org
- Trang sử dụng tại en.wikipedia.org
- Trang sử dụng tại eo.wikipedia.org
- Trang sử dụng tại eu.wikipedia.org
- Trang sử dụng tại fa.wikipedia.org
- Trang sử dụng tại fi.wikipedia.org
- Trang sử dụng tại he.wikipedia.org
- Trang sử dụng tại hi.wikipedia.org
- Trang sử dụng tại hy.wikipedia.org
- Trang sử dụng tại id.wikipedia.org
- Trang sử dụng tại it.wikipedia.org
- Trang sử dụng tại it.wikiquote.org
- Trang sử dụng tại ja.wikipedia.org
- Trang sử dụng tại ko.wikipedia.org
- Trang sử dụng tại la.wikipedia.org
- Trang sử dụng tại mn.wikipedia.org
- Trang sử dụng tại nn.wikipedia.org
- Trang sử dụng tại no.wikipedia.org
- Trang sử dụng tại pa.wikipedia.org
- Trang sử dụng tại pt.wikipedia.org
- Trang sử dụng tại ru.wikipedia.org
- Trang sử dụng tại sl.wikipedia.org
- Trang sử dụng tại sq.wikipedia.org
- Trang sử dụng tại sr.wikipedia.org
- Trang sử dụng tại uk.wikipedia.org
- Trang sử dụng tại zh-yue.wikipedia.org
- Trang sử dụng tại zh.wikipedia.org