Tập tin:Simpson's paradox continuous.svg

Kích thước bản xem trước PNG này của tập tin SVG: 390×260 điểm ảnh. Độ phân giải khác: 320×213 điểm ảnh | 640×427 điểm ảnh | 1.024×683 điểm ảnh | 1.280×853 điểm ảnh | 2.560×1.707 điểm ảnh.
Tập tin gốc (tập tin SVG, 390×260 điểm ảnh trên danh nghĩa, kích thước: 18 kB)
Tập tin này từ Wikimedia Commons. Trang miêu tả nó ở đấy được sao chép dưới đây. Commons là kho lưu trữ tập tin phương tiện có giấy phép tự do. Bạn có thể tham gia. |
W3C-validity not checked.
Miêu tả
| Miêu tả |
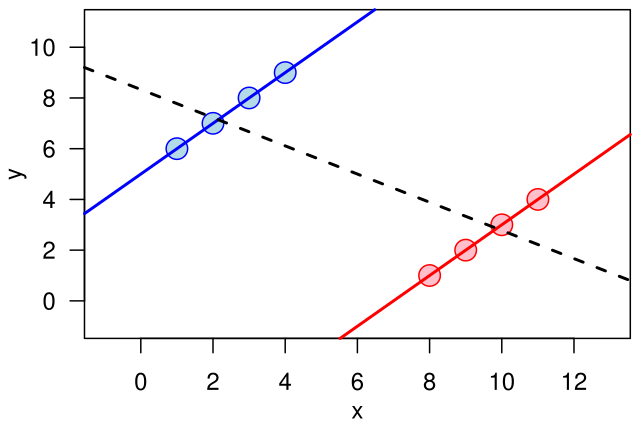
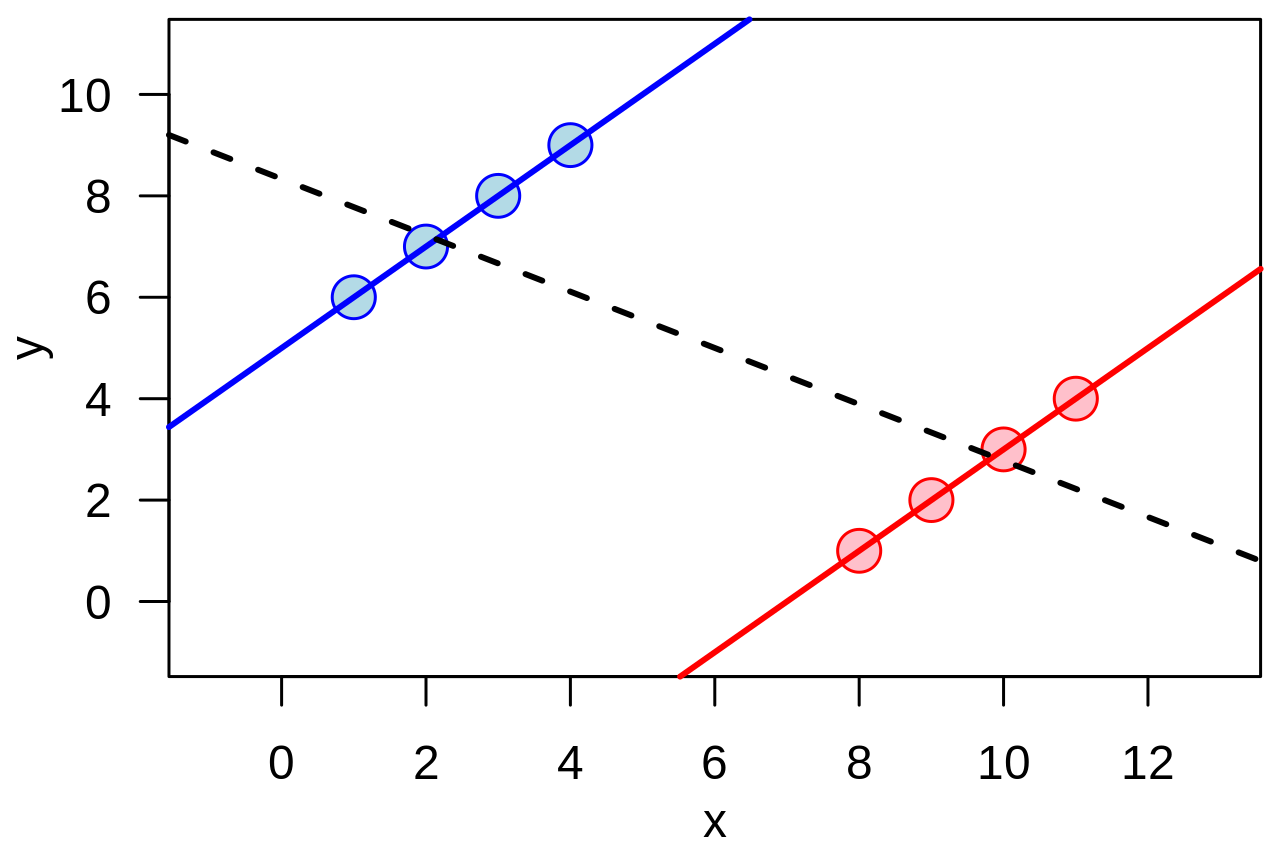
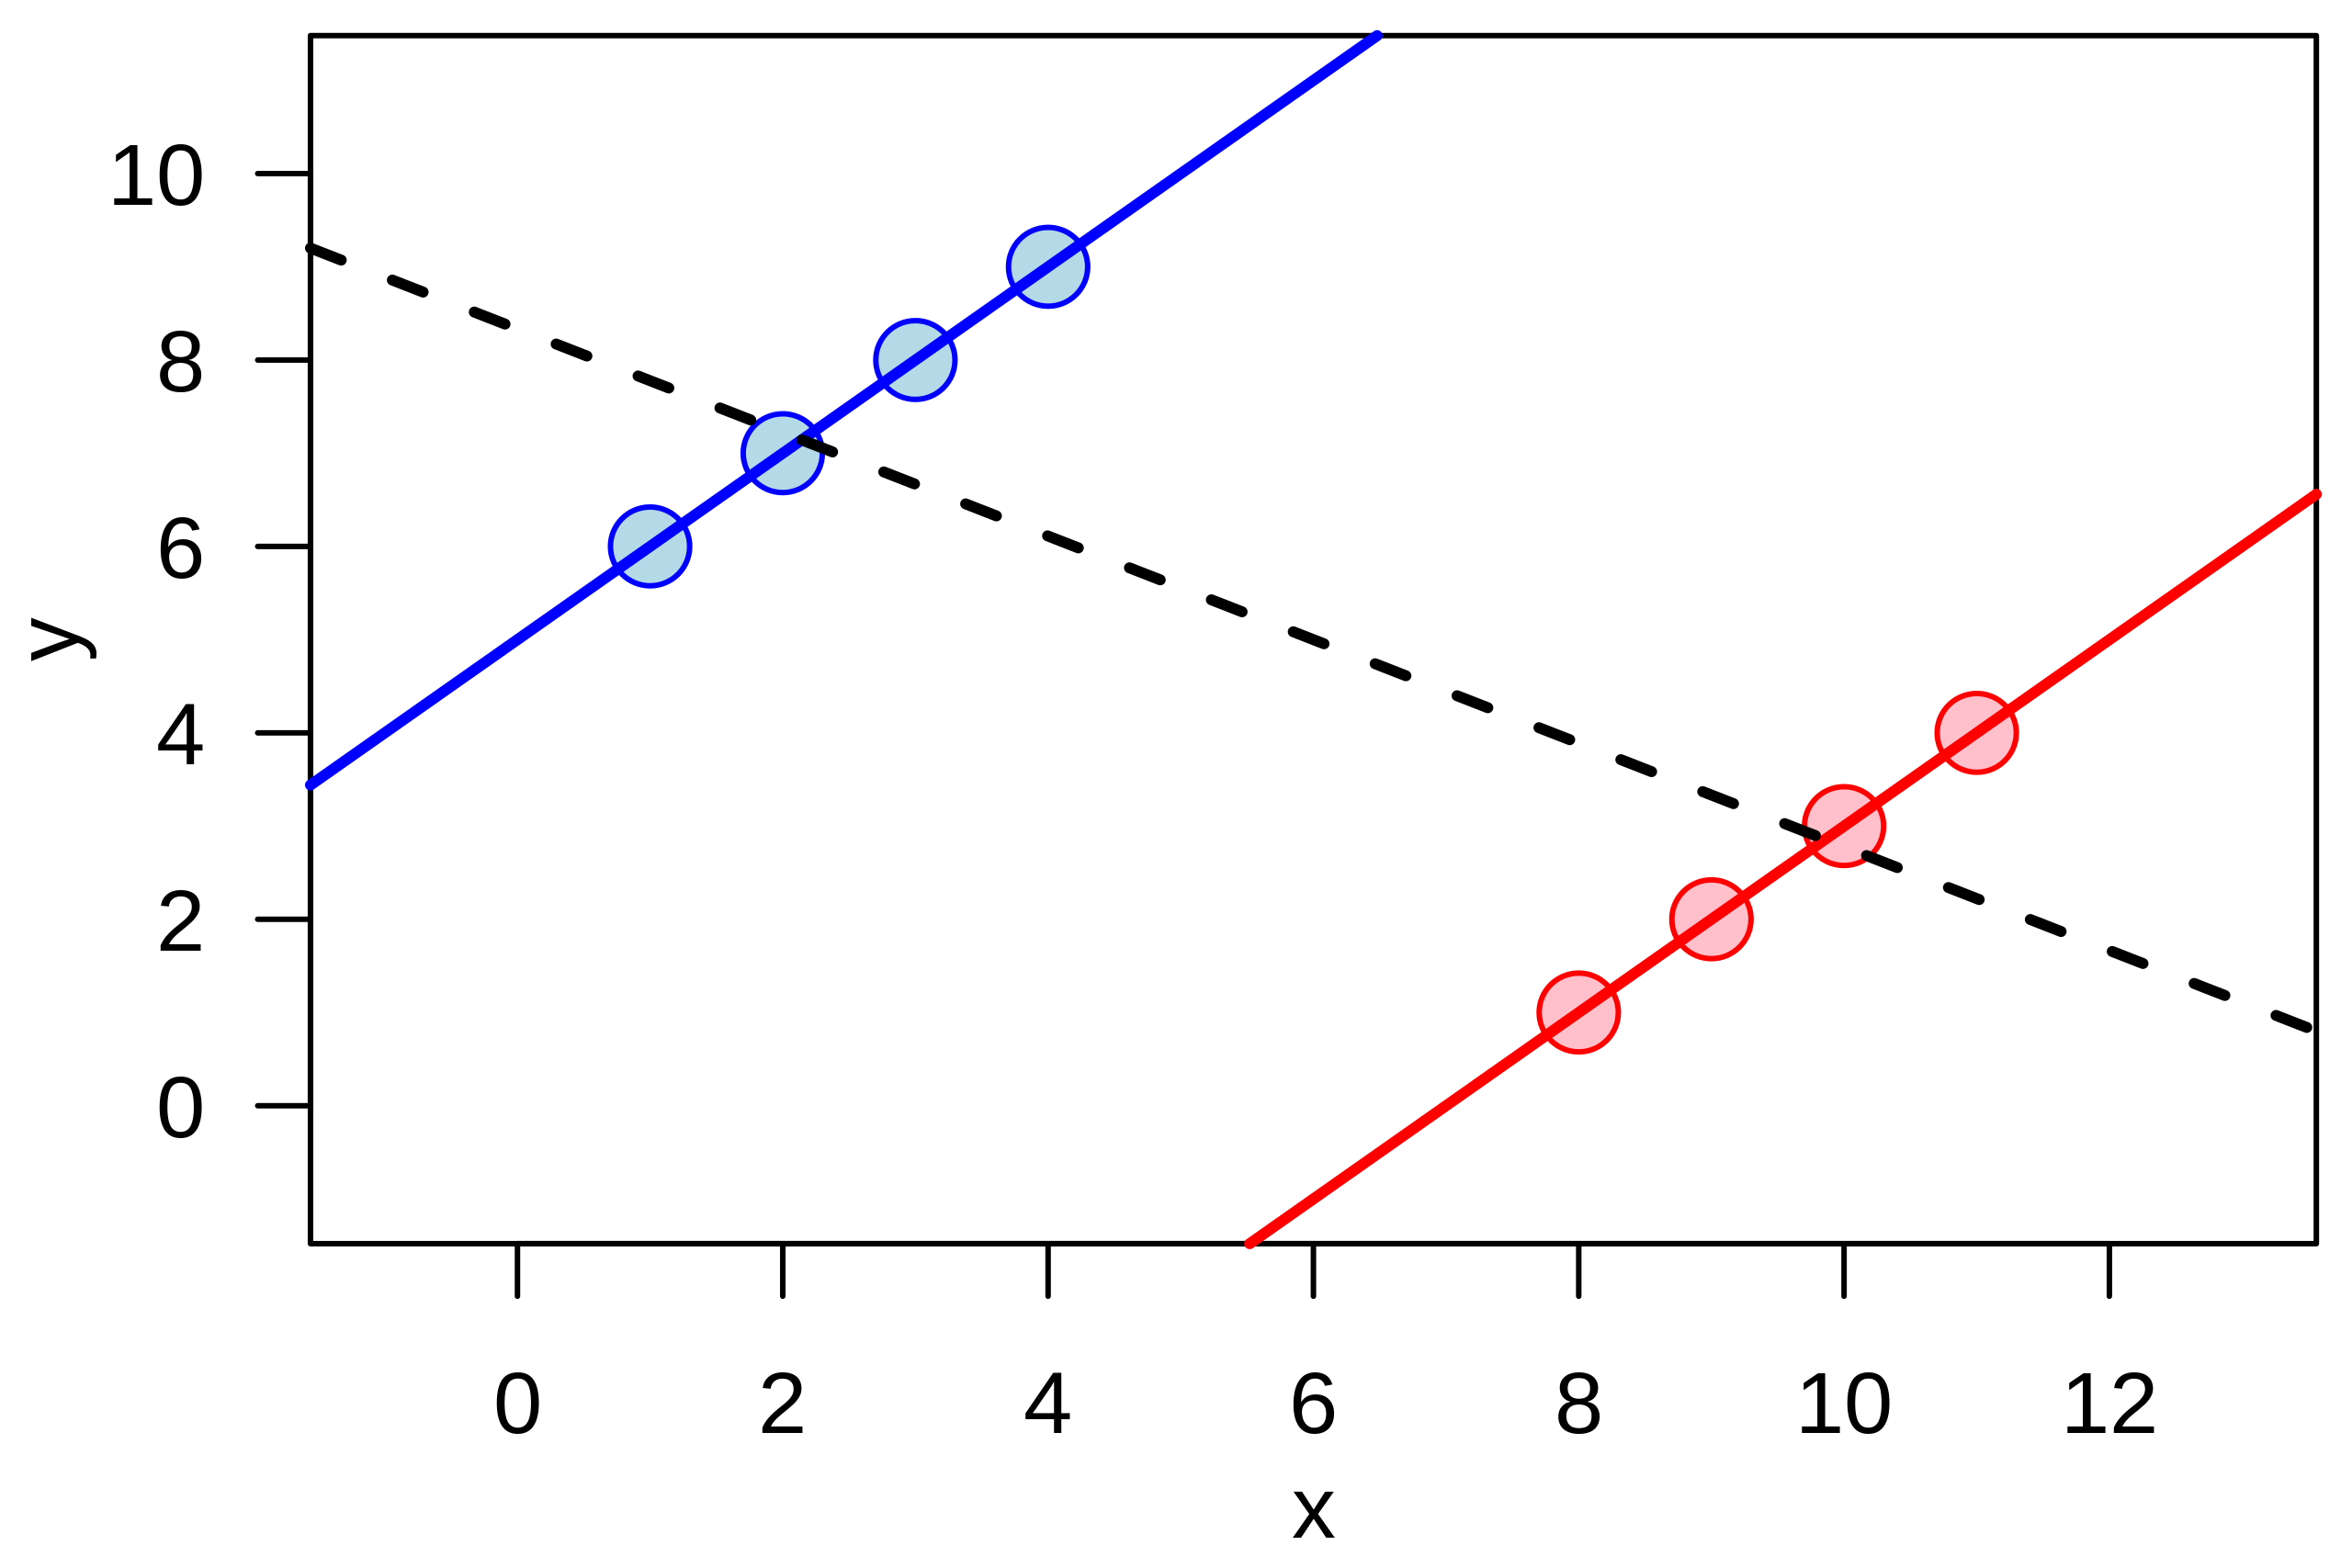
English: Illustration of the quantitative version of en:Simpson's paradox: a positive trend appears for two separate groups (blue and red), whereas a negative trend (black, dashed) appears when the groups are combined. |
| Ngày | |
| Nguồn gốc | Tác phẩm được tạo bởi người tải lên |
| Tác giả | Schutz |
Example of the quantitative version of w:Simpson's paradox.
The graphic was created by User:Schutz for Wikipedia on 14 June 2007, using the R statistical project. The program that generated and exported the graphic is given below; the uploaded version was generated slightly differently to workaround a bug during the PS to SVG conversion with pstoedit command. The layout was slightly modified using Inkscape before upload.
  x1 <- c(1,2,3,4)
  y1 <- x1 + 5

  x2 <- x1 + 7
  y2 <- x2 - 7

  x <- c(x1,x2)
  y <- c(y1,y2)

  postscript("simpson.eps", paper="special", width=4.5, height=3)

  par(las=1)
  par(mar=c(3,3,0.5,0.5))
  par(mgp=c(2,1,0))

  plot(x,y, cex=2, pch=21,
       col=rep(c("blue", "red"), each=4), bg=rep(c("lightblue", "pink"), each=4),
       xlim=range(x)+c(-2,2), ylim=range(y)+c(-2,2))
  abline(lm(y1 ~ x1), col="blue", lwd=2)
  abline(lm(y2 ~ x2), col="red", lwd=2)
  abline(lm(y  ~ x), lwd=2, lty=2)

  dev.off()
Giấy phép
| Tác phẩm này đã được tác giả của nó, I, Schutz, phát hành vào phạm vi công cộng. Điều này có hiệu lực trên toàn thế giới. Tại một quốc gia mà luật pháp không cho phép điều này, thì: I, Schutz cho phép tất cả mọi người được quyền sử dụng tác phẩm này với bất cứ mục đích nào, không kèm theo bất kỳ điều kiện nào, trừ phi luật pháp yêu cầu những điều kiện đó. |
Lịch sử tập tin
Nhấn vào ngày/giờ để xem nội dung tập tin tại thời điểm đó.
| Ngày/giờ | Hình xem trước | Kích cỡ | Thành viên | Miêu tả | |
|---|---|---|---|---|---|
| hiện tại | 23:15, ngày 13 tháng 6 năm 2007 | | 390×260 (18 kB) | Schutz | {{Information |Description=Illustration of the continuous version of Simpson's paradox |Source=self-made |Date=14 June 2007 |Author=Schutz }} Example of the continuous version of w:Simpson's paradox. The graphic was created by [[User |
Trang sử dụng tập tin
Có 1 trang tại Wikipedia tiếng Việt có liên kết đến tập tin (không hiển thị trang ở các dự án khác):
Sử dụng tập tin toàn cục
Những wiki sau đang sử dụng tập tin này:
- Trang sử dụng tại ar.wikipedia.org
- Trang sử dụng tại ca.wikipedia.org
- Trang sử dụng tại cs.wikipedia.org
- Trang sử dụng tại cy.wikipedia.org
- Trang sử dụng tại de.wikipedia.org
- Trang sử dụng tại en.wikipedia.org
- Trang sử dụng tại es.wikipedia.org
- Trang sử dụng tại eu.wikipedia.org
- Trang sử dụng tại fi.wikipedia.org
- Trang sử dụng tại fr.wikipedia.org
- Trang sử dụng tại he.wikipedia.org
- Trang sử dụng tại ko.wikipedia.org
- Trang sử dụng tại nl.wikipedia.org
- Trang sử dụng tại no.wikipedia.org
- Trang sử dụng tại pl.wikipedia.org
- Trang sử dụng tại pt.wikipedia.org
- Trang sử dụng tại ru.wikipedia.org
- Trang sử dụng tại sk.wikipedia.org
- Trang sử dụng tại ta.wikipedia.org
- Trang sử dụng tại uk.wikipedia.org
- Trang sử dụng tại www.wikidata.org
- Trang sử dụng tại zh.wikipedia.org