Tập tin:Speed of sound in water.svg

Kích thước bản xem trước PNG này của tập tin SVG: 720×540 điểm ảnh. Độ phân giải khác: 320×240 điểm ảnh | 640×480 điểm ảnh | 1.024×768 điểm ảnh | 1.280×960 điểm ảnh | 2.560×1.920 điểm ảnh.
Tập tin gốc (tập tin SVG, 720×540 điểm ảnh trên danh nghĩa, kích thước: 36 kB)
Tập tin này từ Wikimedia Commons. Trang miêu tả nó ở đấy được sao chép dưới đây. Commons là kho lưu trữ tập tin phương tiện có giấy phép tự do. Bạn có thể tham gia. |
Miêu tả
| Miêu tả |
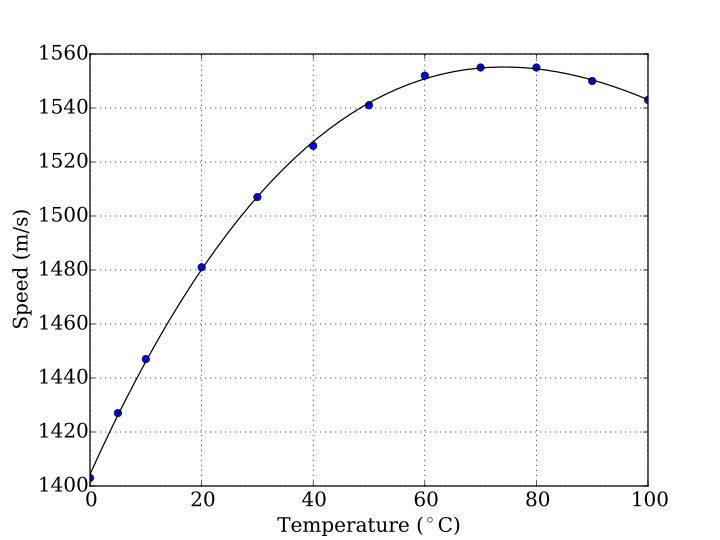
English: Graph of the speed of sound in water vs temperature. Tabulated values (circle markers) from "The Engineering Toolbox" [1].
Smooth continuous line is a 3rd degree polynomial fit (see below) calculated on the tabulated data, accurate within 0.1%.
Español: Gráfico de la rapidez del sonido en el agua versus temperatura. Los datos tabulados (círculos) se obtuvieron de "The Egineering Toolbox" [2].
La línea continua es un ajuste polinomial de orden 3 (ver abajo) calculado a partir de los datos tabulados, la precisión es del 0.1%.
C(T) = a0 + a1T + a2T2 + a3T3 (m/s) """
Plot of the speed of sound versus temperature in water
The data is obtained from "The Engineering Toolbox" [1]_
References
----------
.. [1] The Engineering Toolbox. Water - Speed of Sound.
Accesed: April 27, 2015.
http://www.engineeringtoolbox.com/sound-speed-water-d_598.html
"""
import numpy as np
import matplotlib.pyplot as plt
from matplotlib import rcParams
rcParams['font.family'] = 'serif'
rcParams['font.size'] = 16
data = np.array([
[ 0., 1403.],
[ 5., 1427.],
[ 10., 1447.],
[ 20., 1481.],
[ 30., 1507.],
[ 40., 1526.],
[ 50., 1541.],
[ 60., 1552.],
[ 70., 1555.],
[ 80., 1555.],
[ 90., 1550.],
[ 100., 1543.]])
temp = data[:, 0]
vel = data[:, 1]
a3, a2, a1, a0 = np.polyfit(temp, vel, 3)
temp_fit = np.linspace(0,100)
vel_fit = a0 + a1*temp_fit + a2*temp_fit**2 + a3*temp_fit**3
plt.plot(temp, vel, 'o')
plt.plot(temp_fit, vel_fit, 'k')
plt.grid(True)
plt.xlabel(r"Temperature ($^\circ$C)")
plt.ylabel(r"Speed (m/s)")
plt.savefig("Speed_of_sound_in_water.svg")
|
| Ngày | |
| Nguồn gốc | Tác phẩm được tạo bởi người tải lên |
| Tác giả | K. Krallis, SV1XV |
Giấy phép
Tập tin này được phát hành theo Giấy phép Creative Commons Ghi công 1.0 Chung.
- Bạn được phép:
- chia sẻ – sao chép, phân phối và chuyển giao tác phẩm
- pha trộn – để chuyển thể tác phẩm
- Theo các điều kiện sau:
- ghi công – Bạn phải ghi lại tác giả và nguồn, liên kết đến giấy phép, và các thay đổi đã được thực hiện, nếu có. Bạn có thể làm các điều trên bằng bất kỳ cách hợp lý nào, miễn sao không ám chỉ rằng người cho giấy phép ủng hộ bạn hay việc sử dụng của bạn.
Lịch sử tập tin
Nhấn vào ngày/giờ để xem nội dung tập tin tại thời điểm đó.
| Ngày/giờ | Hình xem trước | Kích cỡ | Thành viên | Miêu tả | |
|---|---|---|---|---|---|
| hiện tại | 21:16, ngày 27 tháng 4 năm 2015 | | 720×540 (36 kB) | Nicoguaro | Similar formatting to other plots in the article. Added Python code (and data) for the automatic generation of the file. |
| 15:24, ngày 26 tháng 8 năm 2014 |  | 757×591 (52 kB) | Sv1xv | {{Information |Description ={{en|1=Graph of the velocity of sound in water vs temperature. Original values and 3rd degree polynomial fit on data from "The Engineering Toolbox" [http://www.engineeringtoolbox.com/sound-speed-water-d_598.html]. Smoothe... |
Trang sử dụng tập tin
Có 1 trang tại Wikipedia tiếng Việt có liên kết đến tập tin (không hiển thị trang ở các dự án khác):
Sử dụng tập tin toàn cục
Những wiki sau đang sử dụng tập tin này:
- Trang sử dụng tại beta.wikiversity.org
- Trang sử dụng tại ckb.wikipedia.org
- Trang sử dụng tại en.wikipedia.org